The Consumer Price Index (CPI) is usually represented by a basket of goods or products. It measures the average change in the price of this basket of goods over a defined period of time. Economists and Policymakers widely use the Consumer Price Index as a measurement for the inflation rate. The CPI is also used as a deflator to convert other economic measurements into “real dollars.” This measurement allows businesses and the government to make an apples to apples comparison.
In the United States, the Bureau of Labor & Statistics (BLS) calculates the Consumer Price Index. They also provide an index for geographical regions within the US.
The BLS creates indexes for two sets of the population – the All Urban Consumers (CPI-U) which covers approximately 93 percent of the total population and a CPI for Urban Wage Earners and Clerical Workers (CPI-W) which covers 29 percent of the population.
How to Calculate the Consumer Price Index (CPI)
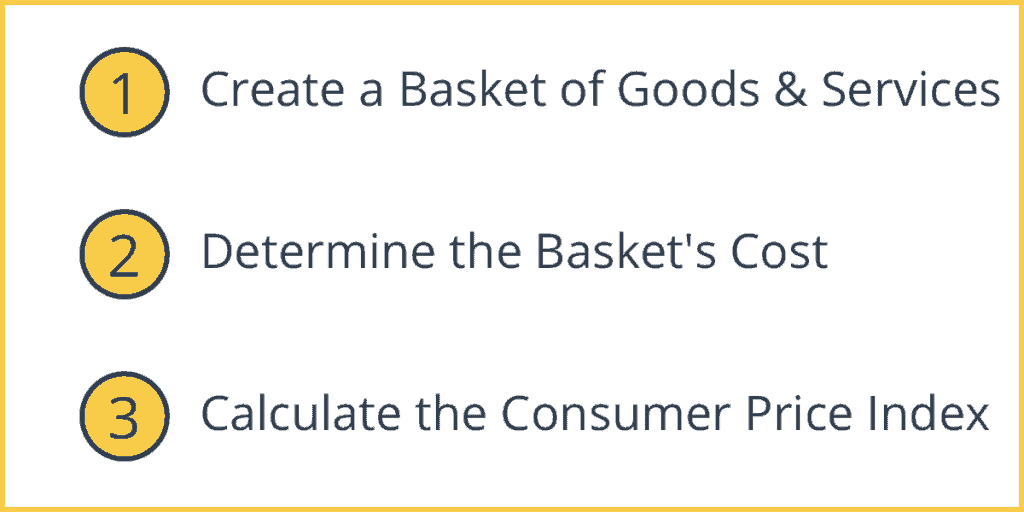
1. Create a Basket of Goods and Services
The CPI basket has to represent all types of goods and services consumed by the population. These include categories such as food and beverages, housing, apparel, transportation, medical care, recreation, education and communications, and other goods and services.
Economists survey households and collect information about their buying patterns, frequently purchased items, and daily expenses. An estimated 14,500 families provide this information every quarter. The data is analyzed and weighted in the basket. This basket is meant to be a representative sample of the entire population and its expenses.
This initiation process typically carried out in person by a CPI data collector, involves selecting a specific item to be priced from the category that has been designated to be priced at that store. For example, suppose a particular grocery store has an outlet where cheese will be priced. A particular type of cheese item will be chosen, with its likelihood of being selected roughly proportional to its popularity. If, for example, cheddar cheese in 8 oz. packages makes up 70 percent of the sales of cheese, and the same cheese in 6 oz. packages account for 10 percent of all cheese sales, and the same cheese in 12 oz. packages accounts for 20 percent of all cheese sales, then the 8 oz. package will be 7 times as likely to be chosen as the 6 oz. package. After probabilities are assigned, one type, brand, and container size of cheese is chosen by an objective selection process based on the theory of random sampling. The particular kind of cheese that is selected will continue to be priced each month in the same outlet.
This item will be repriced, monthly or bimonthly, until it is replaced after four years through sample rotation. Repricing is usually done in person but may be done via telephone or the internet. The process of selecting individual quotes results in the sample as a whole containing a wide variety of specific items of a category roughly corresponding to consumer purchases. So the cheese sample (or the new vehicle sample, the television sample, etc.) contains a wide variety of styles and brands of cheese, vehicles, televisions, etc.
2. Determine the Basket’s Cost
Once the goods and services in the basket have been set, the next step is to calculate all the current prices of the items in the basket. Since we keep the weights and items in the basket fixed, the only thing that will change over time is the price. This kind of set up allows us to separate price fluctuations over the years.
For example, if we assume that our basket only has 3 Apples (priced at $1 in 2019) and 2 Oranges (priced at $0.50 in 2019), then our basket will cost $1×3 + $0.50×2 = $4.00. In 2020, an apple costs $1.25 and an orange costs $0.60 then our basket now costs $1.25×3 + $0.60*2 = $4.95. So we can see that the prices have risen.
The above example is very simplistic, but the actual CPI calculation is a lot more complicated.
3. Calculate the Consumer Price Index (CPI)
The CPI is a relative index, meaning there is a base year. The base years is a benchmark to which all other years are set. In the U.S., “most CPI index series have a 1982-84=100 reference base. That is, BLS sets the average index level (representing the average price level) for the 36 months covering the years 1982, 1983, and 1984 equal to 100; then measures changes in relation to that figure.”
Consumer Price Index (CPI) Formula
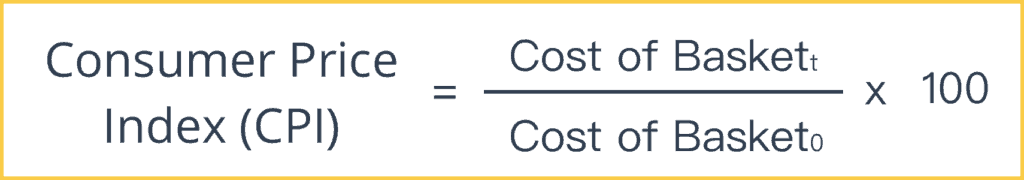
Consumer Price Index = [Cost of Basket(t) ÷ Cost of Basket(0)] x 100
The index is calculated by taking the price of the basket in one year and dividing it by the price of the basket in another year. This ratio is then multiplied by 100. The base year is always 100.
Great explanation. To use for my second year undergrad students.