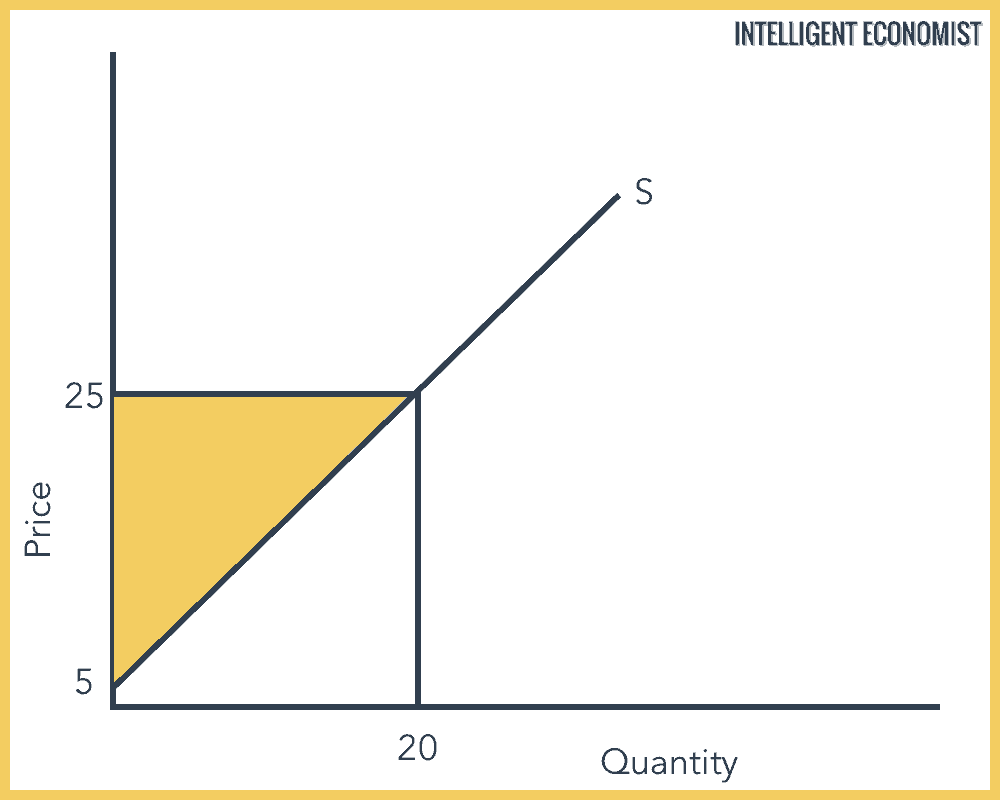
The producer surplus is the area above the supply curve (see the graph below) that represents the difference between what a producer is willing and able to accept for selling a product, on the one hand, and what the producer can actually sell it for, on the other hand. That difference is the amount that the producer receives as a result of selling the good within the market. In other words, the producer surplus actually measures producer welfare.
With a producer surplus, the producer’s costs of production are exceeded and paid for. The producer surplus derives from a situation when market prices are greater than the absolute least amount that producers are prepared to take in exchange for their goods. When prices are higher, there is profit motive–a greater incentive to supply more goods to the market.

How to Calculate Producer Surplus
In the graph above, the producer surplus is = 1/2 base x height. Let’s plug the specific numbers into that equation:
1/2 (20) x (25 – 5) = $200
The market price is $25 with quantity supplied at 20 units (what the producer actually ends up producing), while $5 is the minimum price the producer is willing to accept for a single unit. The base is $20.
Producer Surplus Formula

Referring to a graph like the one shown above, the formula for calculating producer surplus is 1/2 the length of the base multiplied by height.
In addition, more generally, here is the formula for producer surplus:
Producer surplus = total revenue – total cost
In this formula, total revenue refers to the revenue received from selling a particular number of units of a good. Meanwhile, the total cost refers to the cost of producing the number of units of the good. When you subtract the total cost from the total revenue, you discover the producer’s total benefit, which is otherwise known as the producer surplus.
When the price for the good on the market increases, the producer surplus also increases. When the price of the good on the market decreases, the producer surplus likewise decreases.
Producer Surplus Example
Because it is essentially the same across all producers, coffee is a good example of a product for our purposes. However, depending on where it is sold, the price of a cup of coffee can vary widely. Starbucks can charge more than McDonald’s for a cup of coffee because coffee drinkers have strong preferences regarding where they buy their coffee drinks and what they believe is a reasonable price for a cup of coffee. The difference between the lowest available price for a cup of coffee and the highest price is the producer surplus.
If a producer can perfectly price discriminate, it could theoretically capture the entire economic surplus. Perfect price discrimination would entail charging every single customer the maximum price he would be willing to pay for the product.
Producer and Consumer Surplus
In just about all cases, it is assumed that consumers are attempting to maximize their utility at all times. This means that they are attempting to gain as much satisfaction as possible when they consume a product. Based on the limited amount of income that each consumer has, they decide what amount of goods would maximize their utility.
The two concepts of consumer surplus and producer surplus refer to different areas on the demand curve and supply curve. When the two are combined, they will equal the overall economic surplus, which is the benefit created by producers’ and consumers’ interactions in the free market, rather than in a controlled setting (i.e. with quotas, price controls, and the like).
As stated above, only in a situation where producers are price discriminating perfectly–meaning they were able to price their goods at exactly the highest price consumers would be willing to pay for said goods–would the producer surplus be equal to the entire economic surplus.


Your website says “The producer surplus is the area under the supply curve,” which is incorrect. Please check this. Thanks.