Risk is the uncertainty of an asset’s return over a given period of time. Risk perception is the individual judgment people make about the severity of a risk and may vary from person to person.
There are three types of people when it comes to risk:
1. Risk Averse
They hate to lose more than they love to win. They try to avoid taking risks as much as possible.
2. Risk Neutral
These people are not bothered by winning or losing.
3. Risk Loving
These kinds of people love to gamble and take chances. They have a high-risk tolerance
Types of Risk
1. Idiosyncratic/Specific
This is firm or industry specific risk and can be eliminated through diversification. Holding multiple securities means the movements of individual securities “cancel out”.
For example, an investor can mitigate the risk of incurring massive damages because of an oil spill by investing in a broad cross-section of stocks within the portfolio.
In complete markets, there is no compensation for idiosyncratic risk—that is it does not matter for its price. For instance, in a complete market in which the capital asset pricing model holds, the price of security is determined by the amount of systematic risk in its returns.
2. Systematic/Market
Market risk is beyond an individual’s control and cannot be reduced through diversification. It is inherent to an entire market or market segment. It is unpredictable and impossible to avoid altogether.
Systematic or aggregate risk arises from market structure or dynamics which produce shocks or uncertainty faced by all agents in the market; such shocks could result from government policy, international economic forces, or acts of nature. However, buying different types of assets reduces systematic risk (stocks, bonds, gold, real estate).
Idiosyncratic + Systematic = Asset risk
How is Risk Calculated?
Measurement of Risk is the measure of the volatility of an asset’s return.
- Variance: (Expected return – mean return)2/ number of observations. The more the dispersion between the mean and the expected return the more significant the variance.
- Standard deviation: Square root of the variance
- Absolute value deviation: Absolute value of the standard deviation. Absolute value means the number without any sign.
(Note: Expected Return is not always the same as Mean Return. {It’s only the same if mean is a simple average})
Measurement of Risk

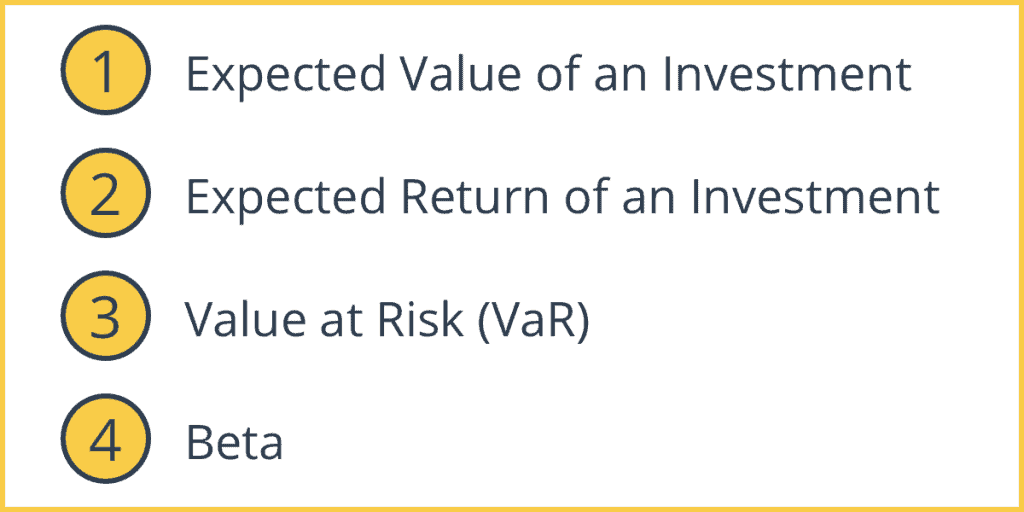
1. Expected Value of an Investment
This is the probability weighted sum of the possible values of an investment. This means the taking the probability of the return occurring multiplied by the return expected. (Sum of pi ri = p1r1 + p2r2 + … + pnrn)
p1 + p2 + pn = 1 (i.e. the sum of all probabilities is 1)
Ex: Information on returns for an asset of 3 years
Returns Probability
Year 1 5% 1/6
Year 2 8% 1/3
Year 3 9% 1/2
Expected Value = 1/65 + 1/38 + ½*9 = 8
2. Expected Return of an Investment
This is the expected value of future payouts minus cost of the investment
Ex: Slot machine costs $1 to play
1 in 5000 chance that the payout = $1000
1 in 500 chance that the payout = $100
1 in 50 chance that the payout = $10
Probability of getting $0 = 1 – (1/5000) – (1/500) – (1/50
Expected payout = Sum piri = 0.2 + 0.2 + 0.2 = $0.6
Expected return = $0.6 – $1.0 = -$.40
Ex: Company’s stock has had the following yearly returns over the past 5 years
5%, 15%, 10%, 2%, 8%
Mean return = 8%
Deviation from mean = (different between each year return and the mean return)
= (5-8), (15-8), (10-8), (2-8), (8-8)
-3, 7, 2, -6, 0
Absolute Deviations = 3%, 7%, 2%, 6% & 0%
Average Absolute Deviation = 18/5 = 3.6%
Variance = Sum of differences/N = 19.6%
Standard Deviation = 4.4%
Ex: Stock 1: mean return of 8%
Standard deviation = 3.6%
Yearly returns (4,12,4,12,8)
Stock 2: mean return of 8%
Standard deviation = 5.1%
Yearly returns (0,16,8,8,8)
You would choose stock 1, less volatility
3. Value at Risk (VaR)
This measures the possible loss over a specific time horizon at a given probability.
Ex: You have $10,000. invest in an index fund (a collective investment that aims to replicate movements of a financial market)
If a 50% loss in a one year period happened in 4 of the past 100 years, we say you have a 4% chance of losing $5000. = (50% of $10000)
4. Beta
Beta is a standard measure of systematic risk. It measures the sensitivity of an asset’s return to changes to the average return on the entire market.
Ex: ß = 1 (holds true for market indexed funds), the market value goes up by 10%, then your asset’s return typically increases by 10%.
Tech/new industries have a ß >1
Utilities/established companies have a ß <1
Long term bonds have a ß approx. 0
Precious metals have ß <0

