In the Cost Theory, there are two types of costs associated with production – Fixed Costs and Variable Costs.
In the short-run, at least one factor of production is fixed, so firms face both fixed and variable costs. The shape of the cost curves in the short run reflects the law of diminishing returns.
Cost Theory – Types of Costs
A. Fixed Cost
Fixed costs are costs that do not vary with different levels of production and fixed costs exist even if the output is zero. Example: rent or salaries.
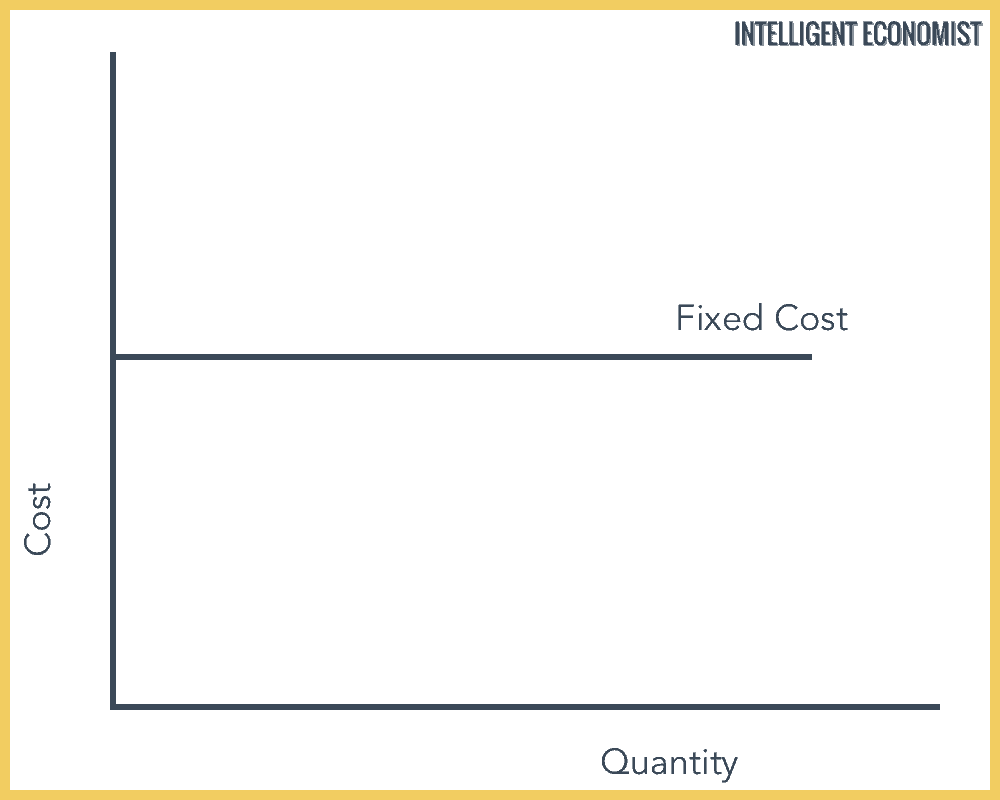
In the above diagram, the fixed cost remains constant regardless of the quantity produced.
B. Average Fixed Cost
Average Fixed Cost = Fixed Costs/Quantity.
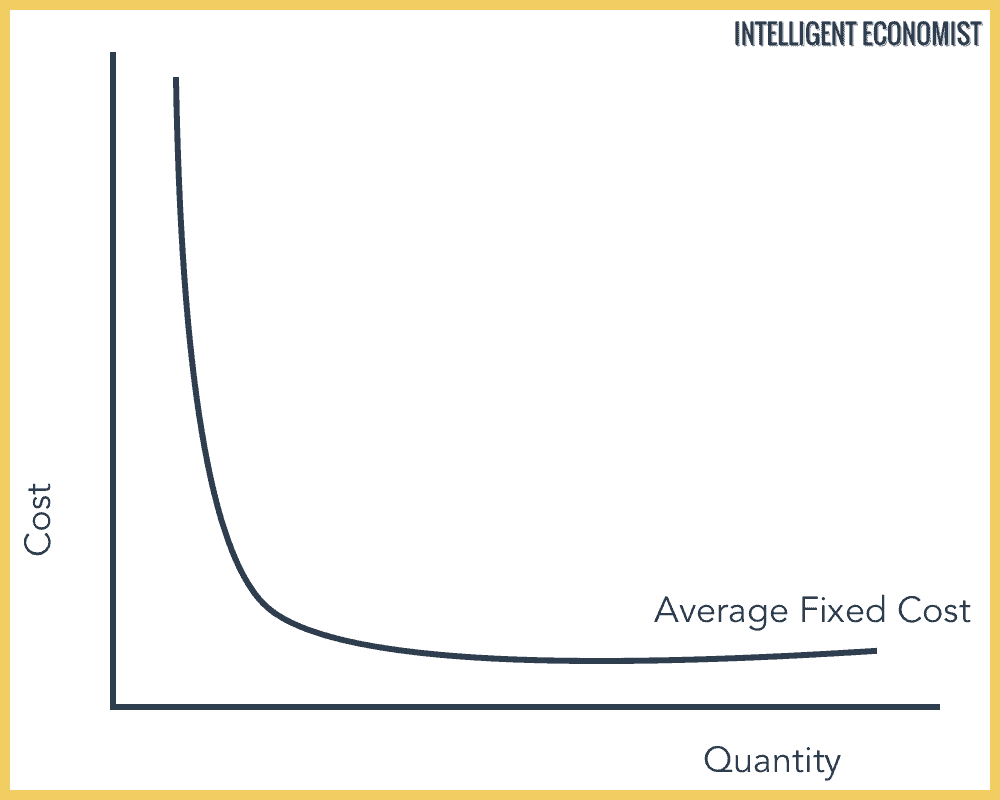
In the above diagram, we see that when the quantity produced is low, the average fixed cost is very high and this cost lowers as the quantity produced increases.
For example, if the Fixed Cost is $100 and initially you produce two units, then the average fixed cost is $50. If you start creating 20 units, then the average fixed cost falls to $5.
C. Variable Cost
Variable Costs are costs that vary with the level of output. Ex: electricity
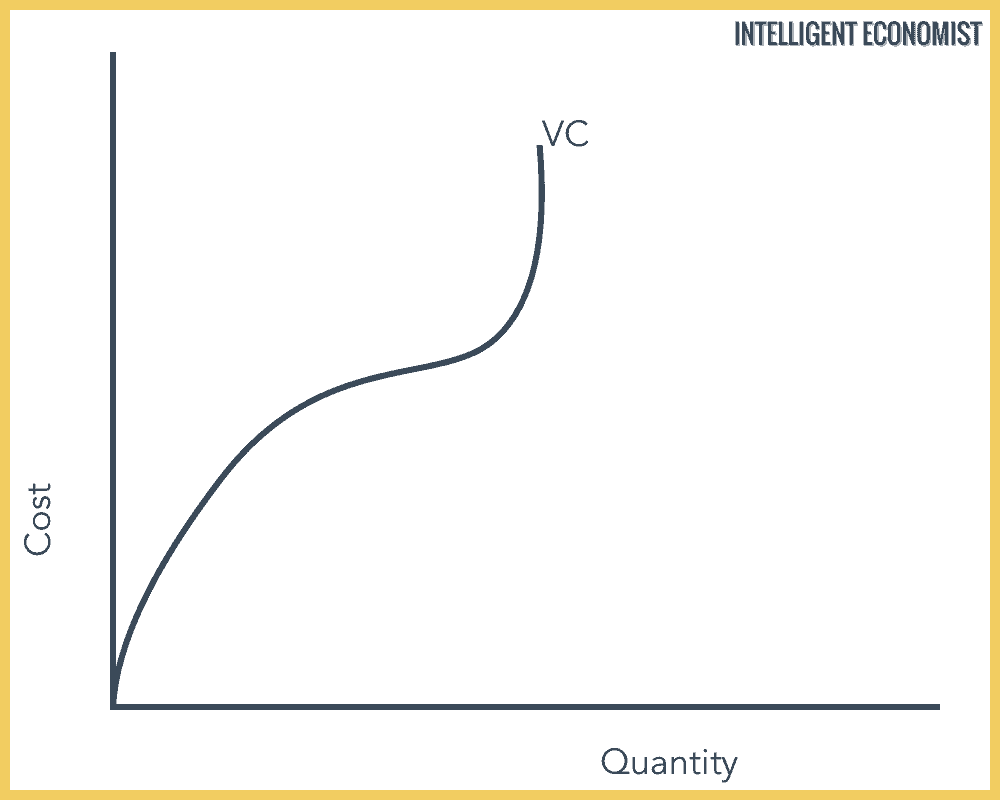
In the above diagram, the variable cost curve starts from zero. It means when output is zero, the variable cost is zero, but as production increases the variable cost increases. It keeps rising to the point that economies of scale cannot lower the per unit cost anymore hence the steep incline.
D. Marginal Cost
Marginal Cost is the increase in cost caused by producing one more unit of the good.
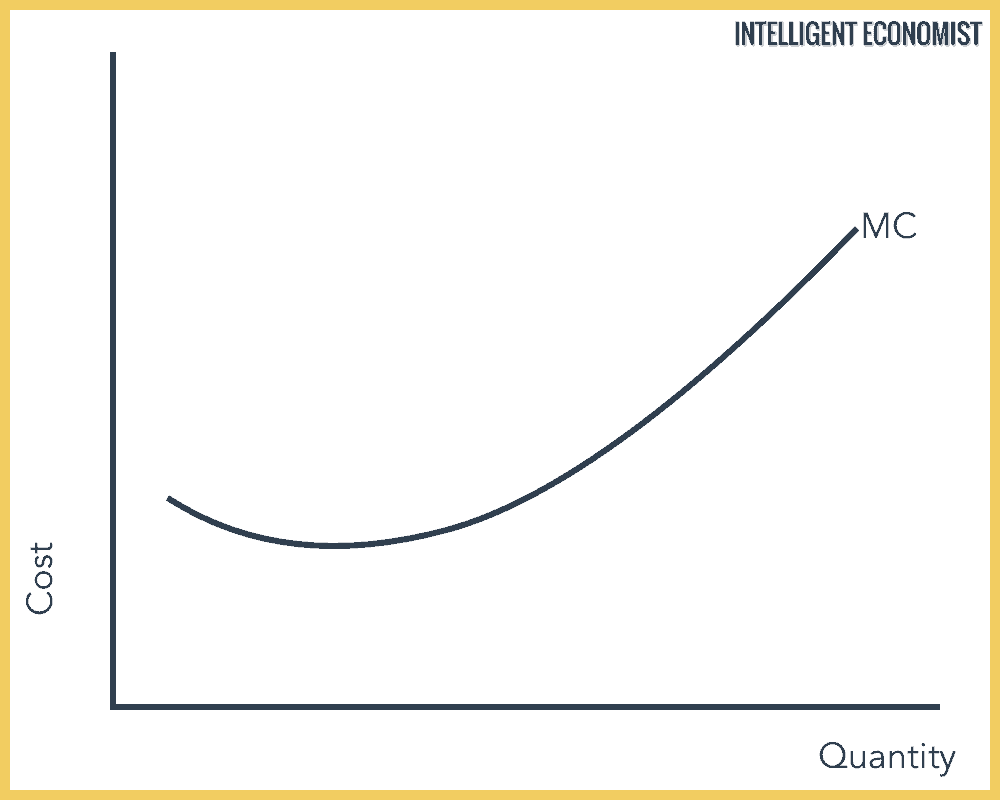
The Marginal Cost curve is U shaped because initially when a firm increases its output, total costs, as well as variable costs, start to increase at a diminishing rate. At this stage, due to economies of scale and the Law of Diminishing Returns, Marginal Cost falls till it becomes minimum. Then as output rises, the marginal cost increases.
E. Total Cost
Total Cost = Fixed Cost + Variable Cost
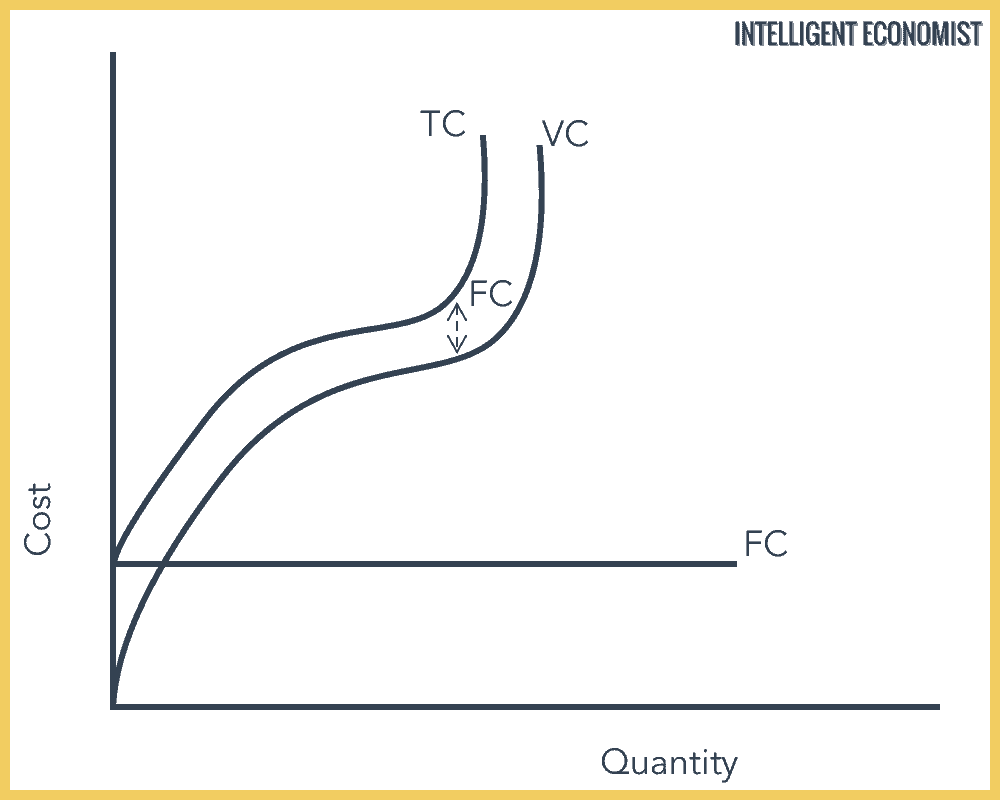
When the output is zero, variable costs are also zero. But we have fixed costs which is where the Total Costs start. The Total Cost remains parallel to the Variable Cost, and the distance between the two curves is the Fixed Cost.
F. Average Total Cost
Average Total Cost = Total Cost/Quantity. (Total Cost = Fixed Cost + Variable Cost)
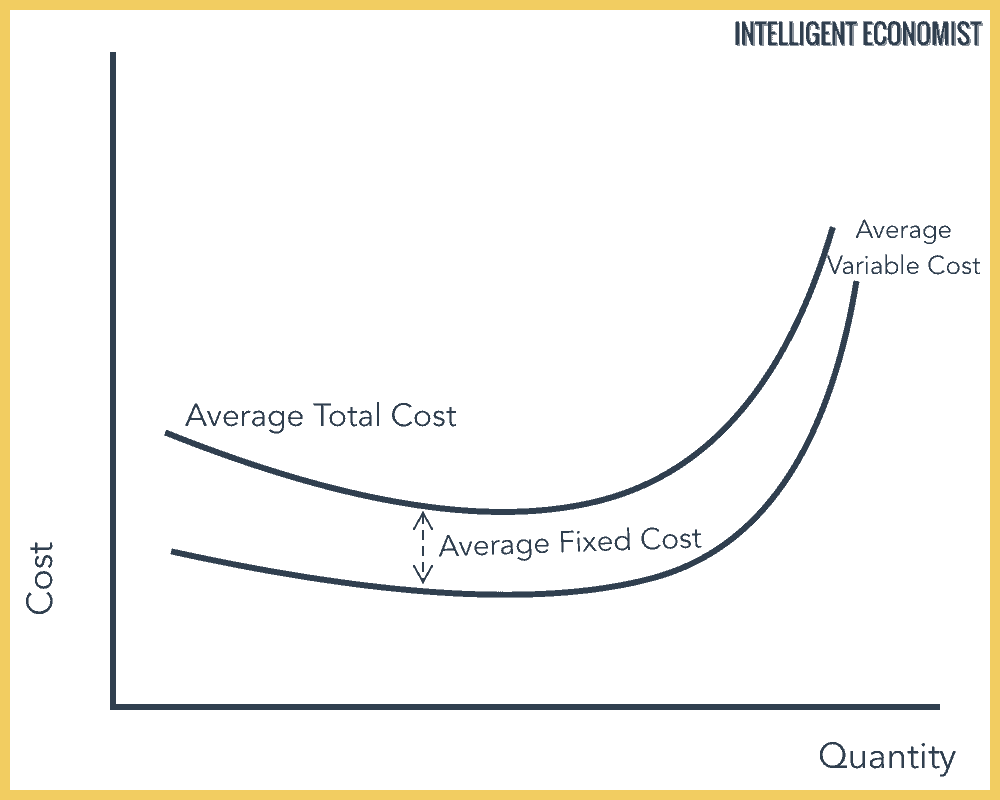
Average Variable Cost = Variable Costs/Quantity.
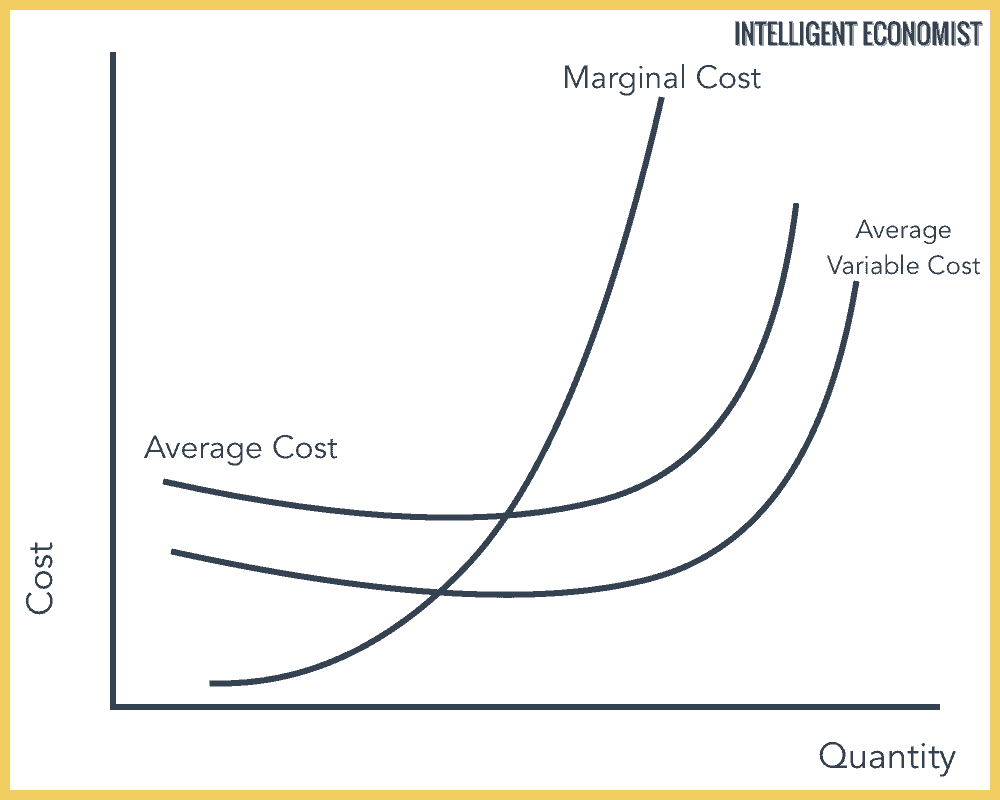
Note: If average costs are falling then marginal costs must be less than average while if average costs are rising then marginal must be more than average. Marginal cost on its way up must cut the cost curve at its minimum point.
If Marginal Cost is less than Average Variable Cost, then the Average Cost goes down.
If Marginal Cost is higher than Average Variable Cost, then the Average Cost goes up.
If Marginal Cost is equal to Average Variable Cost, then the Average Cost will be at a minimum.
Difference between Fixed and Variable Costs
This distinction is important in cost theory. Every firm has the object to maximize profits or minimize losses if losses are unavoidable. At times the price of the product may not cover the average total cost. Then the firm will have to decide whether to shut down or produce some output.
1. The Decision to Shut Down the Firm
The producer may not cover the total costs if the price of the product is less than the short-run average cost. Then the distinction between fixed cost and variable cost is important.
If the price does not cover average variable costs, the firm prefers to shut down. In other words, if the total revenue (total sale proceeds) does not include total variable costs, the business must shut down. Otherwise, its total loss will be higher than the fixed costs. It will produce something only when the price covers the average variable cost and part of the average fixed costs. The output at which marginal cost is equal to marginal revenue keeps losses minimum.
2. Break-Even Point
At times the firm may not make any profit. It just pays to produce a given output. Total revenue is only equal to the total cost. The company has crossed the losses zone and is about to enter the zero profit zone. The output at which total revenue becomes equal to total cost represents the break-even point.

With fixed costs of $400, a firm has average total costs of $3 and average variable costs of $2.50. Its output is: _____ a. 200 units: b. 400 units: c. 800 units: d. 1, 600 units why is the answer 800 units
Section E shows that the difference between the AVC and ATC is simply the fixed cost. Thus, we could say:
FC + AVC(q) = ATC(q)
400 + 2.5(q) = 3(q)
…
q=800
If a carpenter produces 2 units of chairs at a total cost of $90. What are the fixed and variable costs?
There’s not enough information to answer your question
What curve will change when the minimum wage increase and cause the company suffering from break-even state of profitability?
What happen with supply If MC falls, If MC rises Elaborate with numerical examples?
Suppose the production function facing a particular firm is given as
Q=30L+44K-2LK and the cost function given as TC=3L+6K=90
Determine the least cost input combination that maximizes the firms output